Drinking water compatibility
Especially when installing FPV systems on reservoirs intended for drinking water, contamination risk is a highly sensitive topic. Structural materials could potentially leak harmful substances, posing a risk to human health. Careful selection of materials, additives, and coatings is required to avoid this, as we did in our very first project on a drinking water reservoir, called Beerenplaat in the Netherlands. (8,804 solar modules on 1.5 hectares produce 4,876 MWh of electricity, referring to the equivalence of the electricity consumption of around 2,000 average Dutch households)
In BayWa r.e FPV projects, a special biodegradable FR3 fluid is used for transformers instead of traditional synthetic oil. The transformer is surrounded by a collecting tank, sealed to prevent oil discharge into water, even in the unlikely event of a spill.
As for steel coating materials, internal calculations observed zinc loss rates for complete standard FPV units of 1.4ha with Magnelis coating, resulting in ~65kg over 30 years. Even at high coverage ratios (~50% lake coverage at 20m depth), this results in a gain of only 0.1mg/l concentration after 30 years. The maximum allowable limit of zinc concentration in Germany is 800mg/l[52], four orders of magnitude larger than the maximum calculated zinc loss.
When certain plastics are exposed to UV radiation, they can deteriorate, embrittle, and release particles into water.[53] Plastics used in FPV systems, like in the floaters providing buoyancy, need to be UV-stable. In case of fire, materials shouldn’t ignite and melt, with additional risk of substances leaking into the water.
The UV stability of HDPE floaters used in BayWa r.e. projects was tested in accordance with ASTM G154. Samples were subjected to 42 cycles of 8 hours of UVA-340 exposure at 60°C, followed by 4 hours of H2O condensation (dew) at 50°C. One month of these laboratory test settings represents a year of operation in the Arizona climate.
After 26 months of laboratory testing, no wear on the surface of the material samples was detected. The flammability classification was carried out in accordance with DIN 75200. Floater samples were brought into contact with a flame, but could not be ignited. The flame went out quickly once the ignition source was removed.
Mathijssen et al[54] looked at the effect of partial solar panel coverage on a drinking water reservoir in Kralingen, Netherlands. The study looked at the microbial load and pollutant release from solar modules, specifically the mortality rates of cryptosporidia, giardia, and campylobacter.
Results revealed low germ elimination rates and low heavy metal leaching from floats, components, sealing material, and solar modules. The study also investigated organic compounds, but no adverse effects were found. A 30% project-related cover of the lake area is unlikely to impair drinking water use.
Product carbon footprint and reduced CO₂ emissions
It’s important to calculate the CO₂ emissions of a FPV project itself. These should be compared to the savings in emissions vs fossil fuel systems. CO₂ calculations should consider the total lifecycle emissions of FPV systems, including manufacturing, transportation, installation, and decommissioning. Continuous improvements to manufacturing processes and materials improve overall environmental performance.
The BayWa r.e. model focuses on the main steps of the lifecycle and evaluates emissions at each step:
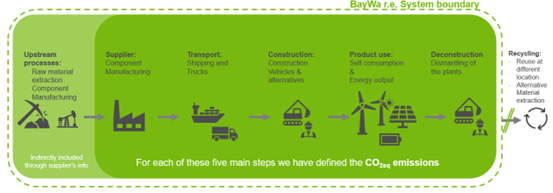
1. Upstream process
includes the entire backpack; raw material extraction, component manufacturing, transports, etc.
3. Transport
includes shipping from China to Europe and truck transport to the project site.
5. Product use
examines inverters and transformer efficiency by calculating load amounts and PV self-consumption.
2. Supplier
considers the product carbon footprint (PCF) of PV modules, mounting structures, inverters, transformers, battery and battery rack housing, HVAC, and cable weights.
4. Construction
looks at construction vehicles’ diesel usage (FPV consumes less than ground-mounted PV.
6. Deconstruction
uses a simplified calculation depending on construction’s emissions (%).
A 12.3MWp FPV project with an average lifetime of 30 years saves 5,194 tonnes of CO₂ per year, compared to a modern gas plant.[55]
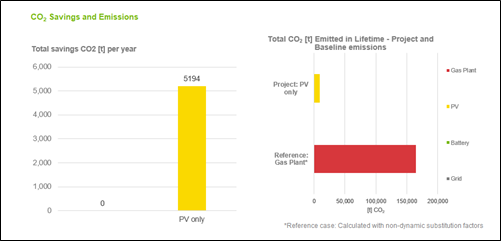
Figure 14: CO₂ savings calculations for a 12.3 MWp FPV project
The CO2eq backpack of the project is amortized after 2.01 years.
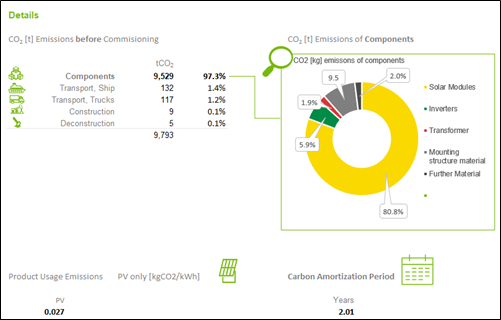
Figure 15: The carbon footprint (in tCO₂) of the various processes within the BayWa r.e. system boundary for the 12.3MWp FPV project
The emission intensity varies according to the underlying sources and scope defined for the assessment. Carbon footprint can range between 500-1041kgCO₂/kWp, with a carbon amortization period between 1.23-2.69 years. The 97.3% footprint contribution from components includes PV modules, inverters, transformers, mounting structure materials, batteries (if present), and cables.
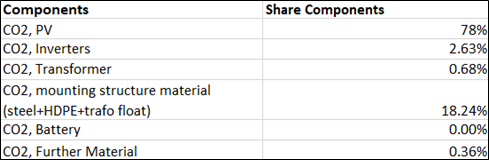
Figure 16: The % contribution to the carbon footprint by the various components
These calculations are based on primary data where available and accessible. Results have limitations in assessing all components across the entire system. This can lead to slight deviations compared to other studies. End-of-life processing is not included in the CO₂ backpack. Results of our internal calculations primarily show CO₂ savings from lifecycle emissions.
To summarize, FPV represents a tangible and effective strategy for lowering CO₂ emissions. It helps shift the energy landscape towards a more sustainable and low-carbon future.